作者:老余捞鱼
原创不易,转载请标明出处及原作者。
写在前面的话:本文介绍了如何利用支持向量回归(SVR)算法来预测股票价格,特别是针对日内交易的应用,并通过实际代码示例详细讲解如何使用 Python 中的 yfinance 和 scikit-learn 库来获取数据、准备数据集、训练 SVR 模型以及进行价格预测和结果可视化。
一、什么是 SVR?
在我们开始深入探讨之前,让我们先快速了解一下什么是 SVR。
SVR(支持向量回归 Support Vector Regression),它是支持向量机(SVM)在回归分析上的应用。这是一种可以预测连续值的机器监督学习算法,主要用于回归分析和预测数值型数据的输出。与传统的线性回归不同,SVR 的目标是在指定的容差(ε)范围内找到最佳拟合。这使它成为预测波动股价的完美工具!SVR在处理非线性问题和高维数据时表现出色,广泛应用于金融分析、时间序列预测、股票价格趋势预测以及生物信息学等领域。
二、数据准备工作
2.1 获取当日数据
对于日内交易,我们感兴趣的是盘中数据–每分钟的股票价格。我们将使用 yfinance 库来获取这些数据。
# Install necessary libraries
!pip install yfinance
!pip install scikit-learn

# Import libraries
import yfinance as yf
import numpy as np
import pandas as pd
from sklearn.svm import SVR
from sklearn.preprocessing import StandardScaler
from sklearn.model_selection import train_test_split
from sklearn.metrics import mean_squared_error
import matplotlib.pyplot as plt
import matplotlib.dates as mdates

# Fetch intraday data for a stock, e.g., Apple Inc. (AAPL)
ticker = yf.Ticker("AAPL")
stock_data = ticker.history(period="1d", interval="1m")
stock_data = stock_data[['Close']]  # Use only the 'Close' price for simplicity
stock_data.reset_index(inplace=True)
2.2 准备数据
接下来为 SVR 模型准备数据,这包括创建交易日的小时和分钟等特征。
# Prepare the data
stock_data['Hour'] = stock_data['Datetime'].dt.hour
stock_data['Minute'] = stock_data['Datetime'].dt.minute

X = stock_data[['Hour', 'Minute']]
y = stock_data['Close']

# Split into training and testing sets
X_train, X_test, y_train, y_test = train_test_split(X, y, test_size=0.2, random_state=42)

# Scale the features
scaler = StandardScaler()
X_train_scaled = scaler.fit_transform(X_train)
X_test_scaled = scaler.transform(X_test)
三、训练 SVR 模型
我们将使用 scikit-learn 库训练 SVR 模型。
# Initialize and train the SVR model
svr_model = SVR(kernel='rbf', C=100, gamma=0.1, epsilon=0.1)
svr_model.fit(X_train_scaled, y_train)
Scikit-learn 是机器学习领域中最完整、最具影响力的开源Python机器学习库之一,是数据分析师首选的机器学习工具包,它提供了丰富而强大的工具,用于数据挖掘和数据分析。无论是初学者还是经验丰富的数据科学家,都可以通过Scikit-learn来高效地进行数据挖掘和数据分析工作。
四、进行预测和绘制结果图
模型训练完成后,我们就可以进行预测并将结果可视化。图表上的红点代表我们模型的预测结果。
# Predict on the test set
y_pred = svr_model.predict(X_test_scaled)

# Evaluate the model
mse = mean_squared_error(y_test, y_pred)
print(f'Mean Squared Error: {mse}')

# Plot the results
plt.figure(figsize=(14, 7))
plt.plot(stock_data['Datetime'], stock_data['Close'], label='Actual Prices')
plt.scatter(stock_data['Datetime'].iloc[X_test.index], y_pred, color='red', label='Predicted Prices')
plt.xlabel('Time')
plt.ylabel('Stock Price')
plt.title('SVR Model - Intraday Actual vs Predicted Prices')
plt.legend()

# Format x-axis to show hours and minutes
plt.gca().xaxis.set_major_formatter(mdates.DateFormatter('%H:%M'))
plt.gca().xaxis.set_major_locator(mdates.HourLocator(interval=1))
plt.gcf().autofmt_xdate()  # Rotation

plt.tight_layout()
plt.show()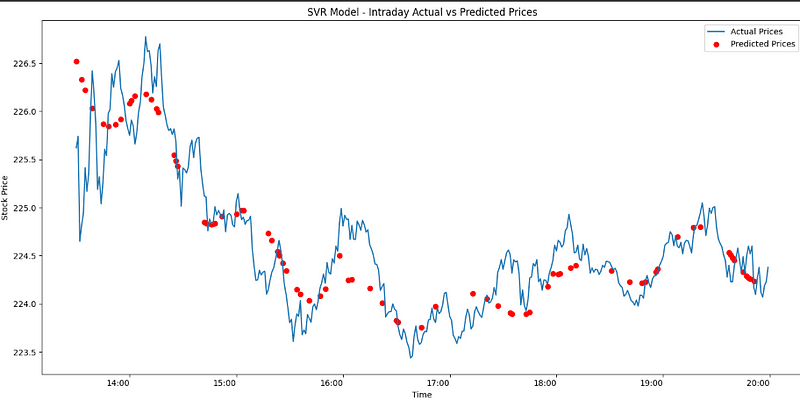
SVR 图表中的红点通常代表 SVR 模型生成的预测值。在当日交易和股票价格预测中,这些红点表示 SVR 模型在交易日特定时间点预测的价格。具体来说:
- 在 SVR 结果的散点图中,红点是预测的股票价格与实际价格的对比图。
- 红点(预测值)与实际值的接近程度表明 SVR 模型的准确性。如果红点紧跟实际价格点或与之重叠,则表明模型在预测股票价格方面表现良好。
- 在日间交易应用中,这些红点代表 SVR 模型对短期间隔的价格预测,如每分钟或每小时的预测。
- 交易者会利用这些红点相对于实际价格的位置来做出交易决策。例如,如果红点预测的价格始终高于当前的实际价格,这可能预示着潜在的买入机会。
值得注意的是,虽然这些预测(以红点表示)在日内交易中很有用,但它们不应成为交易决策的唯一依据。SVR 模型的预测应与其他技术指标、基本面分析和合理的风险管理措施结合使用,以制定有效的日内交易策略。
我再给大家一段预测下一分钟价格的代码,这对快速做出交易决策非常有用。
# Predict the next minute's price
last_minute = stock_data.iloc[-1][['Hour', 'Minute']]
next_minute = last_minute.copy()
next_minute['Minute'] += 1
if next_minute['Minute'] == 60:
    next_minute['Hour'] += 1
    next_minute['Minute'] = 0
next_minute_scaled = scaler.transform([next_minute])
next_price = svr_model.predict(next_minute_scaled)

print(f"Predicted price for the next minute: ${next_price[0]:.2f}")

# Calculate and print the trading day's time range
start_time = stock_data['Datetime'].min().strftime('%H:%M')
end_time = stock_data['Datetime'].max().strftime('%H:%M')
print(f"Trading day time range: {start_time} - {end_time}")
五、观点回顾
只需要上面的这些代码,我们就建立了一个 SVR 模型来预测日内交易的股票价格。但请记住,虽然 SVR 是一个强大的工具,但它应与其他技术指标和合理的风险管理方法结合使用。
- SVR 是预测股票价格的有效工具:由于其在指定容差内寻找最佳拟合的特性,SVR 能够更好地处理股票价格的波动性。
- 数据准备对模型性能至关重要:文章中的数据预处理步骤,如特征提取、数据标准化等,对于提高模型预测的准确性至关重要。
- 模型评估和结果可视化有助于理解模型性能:通过计算 MSE 和绘制实际价格与预测价格的图表,可以直观地评估 SVR 模型的预测能力。
- SVR 模型的预测应与其他分析方法相结合:虽然 SVR 模型可以提供有价值的预测,但它应该与其他技术指标、基本面分析和风险管理措施相结合,以做出更明智的交易决策。
代码地址: https://colab.research.google.com/drive/1Oq0WccMieBHVFMcHxZ6eVt2DJe-qMoyI
感谢您阅读到最后,希望本文能给您带来新的收获。祝您投资顺利!如果对文中的内容有任何疑问,请给我留言,必复。
本文内容仅仅是技术探讨和学习,并不构成任何投资建议。
转发请注明原作者和出处。
Be First to Comment